
Attach debugger from the task pane
We’re happy to announce the availability to attach the debugger from the task pane for Office Add-ins. This attach debugger feature will directly attach the debugger to the correct Internet Explorer process for you. You can attach to the debugger regardless even if the add-ins is written using a non-Visual Studio flow, eg. Yeoman Generator, Visual Studio Code, node.js, Angular, etc.
Take for example the Word-Add-in-JS-Redact add-in sample on GitHub. It’s written using node.js and requires npm.
In Office 2016 for Windows, Build 77xx.xxxx or later, you can attach it to the debugger from the task pane. To launch the Attach Debugger tool, click on the top right hand corner of the task pane to activate the Personality menu (as highlighted by the red circle in the following image).

Select Attach Debugger. This launches the Visual Studio Just-in-Time Debugger dialog as shown in the following image.
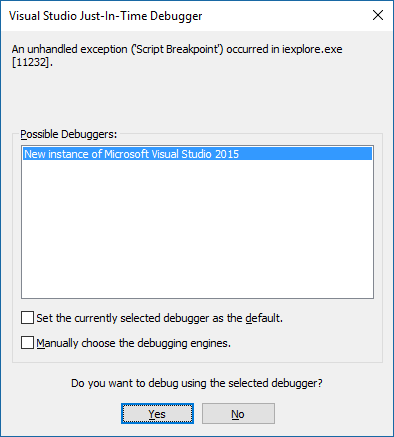
You can then attach and debug in Visual Studio as shown in the following screenshot.
Note: Currently the only supported debugger tool is Visual Studio 2015 with Update 3. If Visual Studio is not installed on the computer, selecting the Attach Debugger option doesn’t result in any action.

You can set breakpoints, examine the objects or variables, use the DOM Explorer, etc.
To learn how to:
- Launch and use the DOM Explorer in Visual Studio, see Tip 4 in Tips and Tricks section of the blog post.
- Set breakpoints, see Using Breakpoints.
- Use F12, see Using the F12 developer tools.
You can also find the above information in the Debug your add-in section of this topic.
Happy Coding!
 Light
Light Dark
Dark