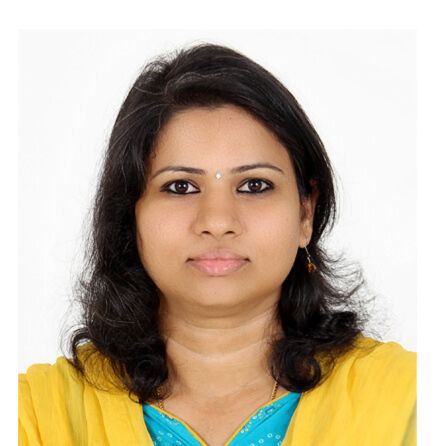
Dr. Gomathi S
ATNA Technologies


十月 9, 2024 | 12:00 - 1:00 下午 (UTC) 协调世界时
准备好开始使用 AI 和最新技术了吗? Microsoft Reactor 提供活动、培训和社区资源,帮助开发人员、企业家和初创公司利用 AI 技术等。 快加入我们吧!
十月 9, 2024 | 12:00 - 1:00 下午 (UTC) 协调世界时
准备好开始使用 AI 和最新技术了吗? Microsoft Reactor 提供活动、培训和社区资源,帮助开发人员、企业家和初创公司利用 AI 技术等。 快加入我们吧!
十月 9, 2024 | 12:00 - 1:00 下午 (UTC) 协调世界时
 直播
直播主题: 新式数据和分析
语言: 英语
In this session, we will dive into the top three custom visuals in Power BI that you need to know about. These visuals will help you go beyond standard charts, enabling you to create more dynamic, interactive, and insightful reports. We’ll explore their features, use cases, and how to effectively incorporate them into your Power BI dashboards to drive better business decisions.
Read More- https://aka.ms/Custom-data-visualizations
The session will focus on:
How to leverage custom visuals in Power BI to create more engaging and insightful reports.
What will the attendees learn from session?
Attendees will learn how to effectively implement and customize these top three visuals in Power BI to elevate their data visualization game.
Speaker Bio:
Dr. Gomathi S. is a Microsoft MVP, MCT, and Microsoft Certified Trainer with a wealth of experience in business intelligence, data analytics and Business Central. She heads the Learning and Development team at Atna Technologies, where she specializes in creating AI-driven solutions and innovative data visualizations. Dr. Gomathi is dedicated to empowering others to harness the full potential of their data through Power BI and other advanced tools.
Social Handle of the speaker:
LinkedIn: https://www.linkedin.com/in/gomathisri/
YouTube: https://www.youtube.com/@gomstechtalks
Instagram: https://www.instagram.com/goms_tech_talks/
主讲人
Dr. Gomathi S
ATNA Technologies
你也可能对以下活动感兴趣。 请务必访问我们的 Reactor 主页 查看所有可用活动。
形式:
直播
主题: 数据和分析
语言: 英语
此活动属于 #MVPConnect Series.
单击此处 访问“系列”页 可在此处查看所有即将举办的活动和点播活动。