
How to Implement Real-time Analytics in Online Games
Welcome back to the LiveOps Academy part 4 where we dive into some analytics best practices.
Timely, in-depth data helps developers understand their players and give them what they want (and sometimes what they didn't even know they wanted!). Insights gained from advanced analytics are invaluable for future content development, marketing, gameplay troubleshooting and growing a community.
While this is not an in-depth guide for implementing and running real-time analytics in PlayFab (you can find that documentation here), these are some best practices for using analytics to build and grow your game as part of a LiveOps strategy.
PlayFab LiveOps Analytics
- Which Metrics Matter?
- Best Practices for Real-Time Analytics
- Analytics Features in PlayFab
LiveOps Game Analytics – Which Metrics Matter?
Best practice: Learn which metrics matter most to your game, and how they intersect.
Before diving into in-depth analytics strategy, we'll look at the most commonly used metrics in LiveOps. All of these can be measured over your game's life cycle, or limited to a specific time period:
| Metric | Definition & Use |
| ARPU (Average Revenue Per User) | Total number of unique players divided by total revenue in a given period. Can gauge the general business health of your game. |
| ARPPU (Average Revenue per Paying User) | Like ARPU but limited to purchasing players. Useful for gauging monetization strategies, such as in-game store design or store price points. |
| Unique Logins | Fairly self-explanatory, used to monitor active player population. |
| Conversion Rate | Total number of players who made purchases divided by unique logins. Gauges how well you convert free users into paid users. |
| Retention | Total number of players that logged into your game during two specific date ranges. Common gaps between reporting periods are 1-day, 7-day, and 30-day measures. |
| Avg. Session Length | Another self-explanatory metric, used to gauge how long your gameplay loop is fun or keeps players' attention. |
| Session Frequency | Number of players logged in, divided by the total number of login events. Gauges how often players engage with the game. |
| LTV (Lifetime Value) | Total number of unique players divided by total revenue generated. Gauges how high your ROI (return on investment) is per player. |
| Errors | Counts errors generated by code. Gauges how stable your game is. |
| Content Logs | Counts occurrences of specific logs unique to your game's content being triggered. Gauges popularity, stability, and engagement of specific content. |
One thing to consider with these metrics is optimal data speed and collection periods. Some metrics will only need to be reviewed occasionally (e.g. Average Revenue), while others will benefit from constant real-time updates (e.g. Errors).
Best Practices – Game Analytics from Pre-Launch to Post-Launch
Best Practice: Before launch, research industry data for similar games and set performance benchmarks to test against.
Before you launch (or even implement analytics) you can learn from industry data to give your team benchmarks to measure against. For example, the first-day retention rate for idle games is usually over 50%, compared to just 30% for strategy games. Benchmark stats will vary based on country, platform, and other factors.
Best Practice: Invest in your data pipeline to give your game more potential to grow post-launch.
Real-time analytics and a solid data pipeline are the backbones of a LiveOps strategy. A reliable source of data lets you respond to player preferences and needs to improve your game and profitability.
Best Practice: Look for data trends that lead to actionable insights for future iterations.
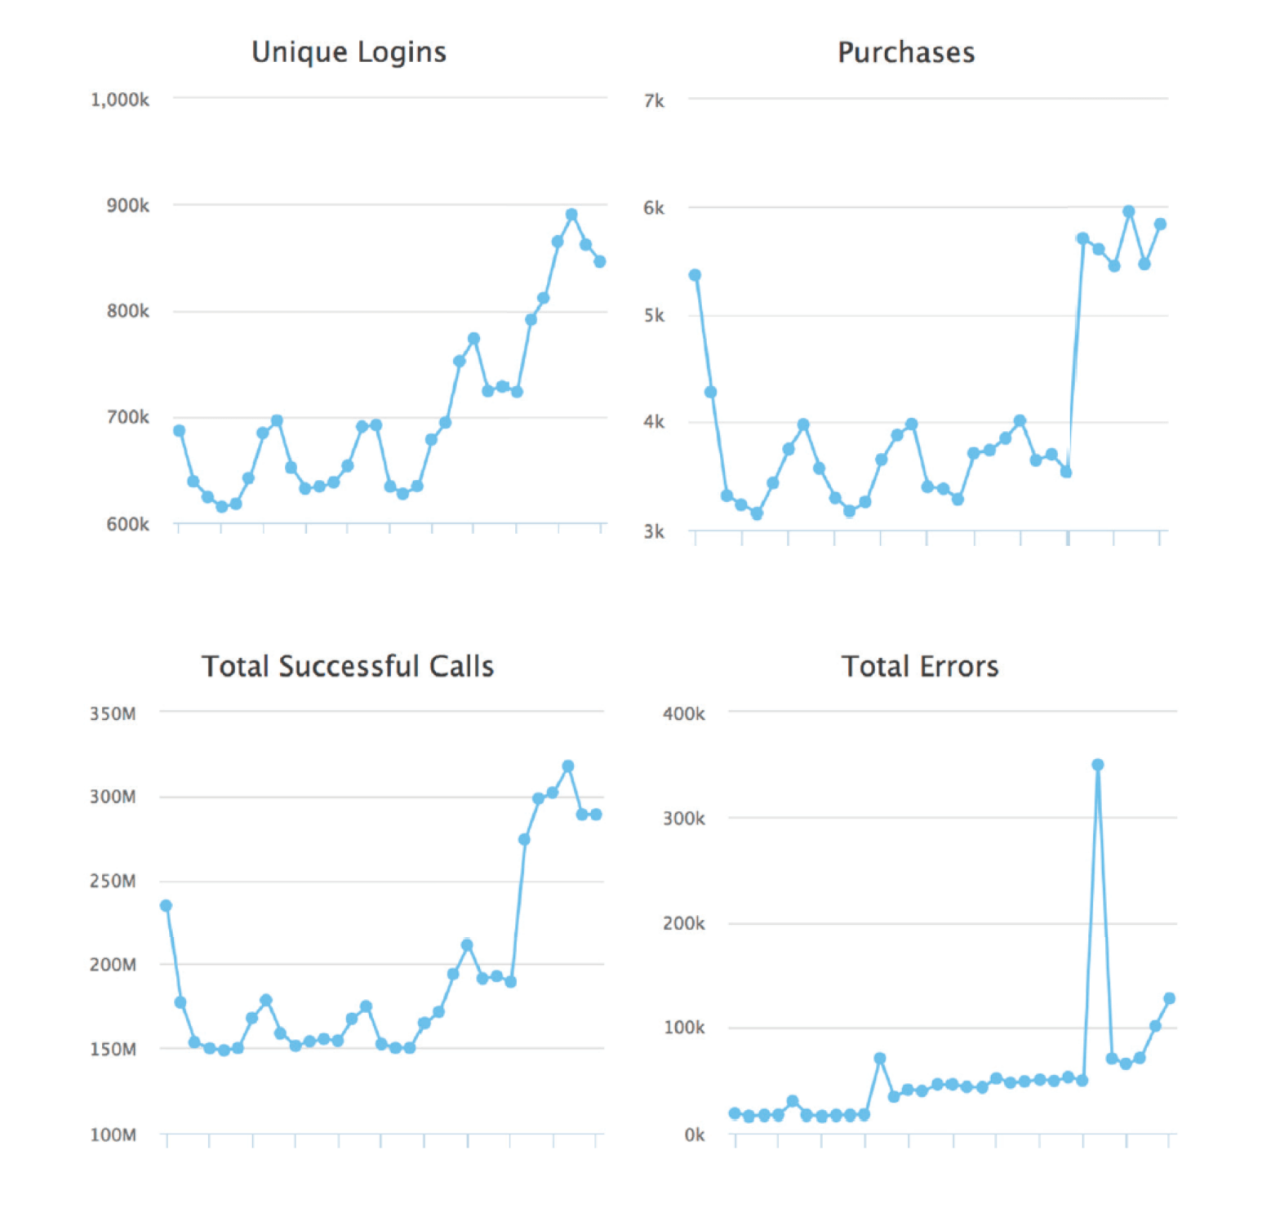
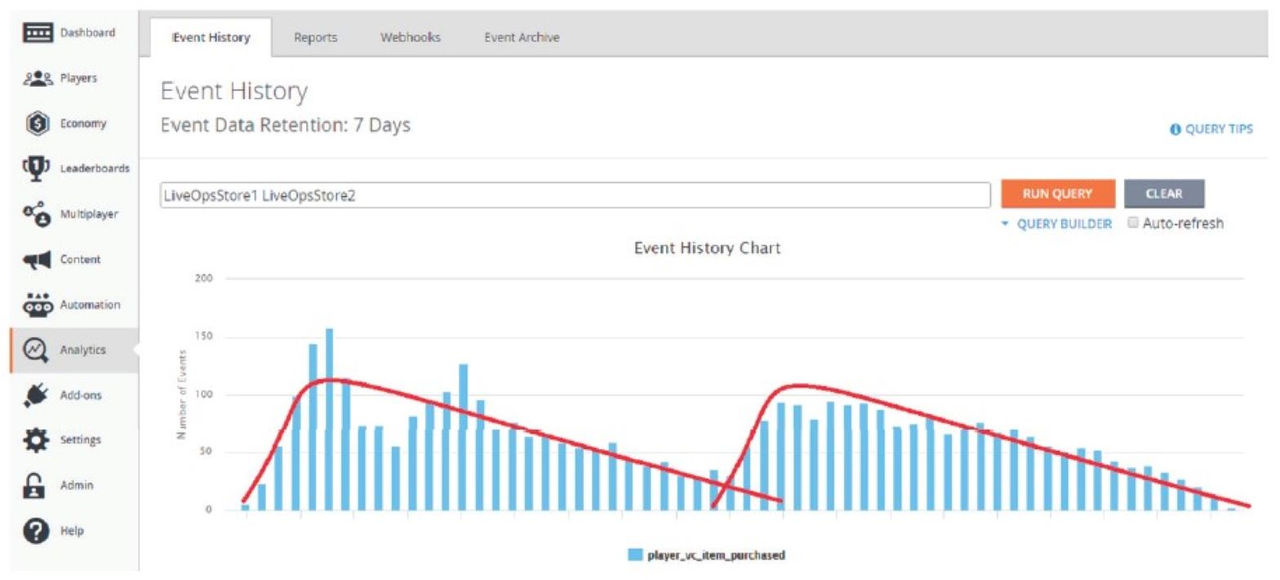
With your game launched and a data pipeline in place, look for trends in relevant metrics. In your data visualizer, get a feel for cyclical trends such as weekdays vs. weekends, as well as broader seasonal trends (e.g. school holidays) and the impact of events and updates. You should also be able to drill into your event history across custom event queries to help you track and optimize performance and monetization of your live events and benchmark your performance.
Look for actionable metrics. That's where segmentation comes in. While Retention by itself isn't actionable, testing and segmentation can turn a low retention rate into an actionable question like "What's the difference between my players who reach level 50 vs. those who drop out before level 10, and how can I encourage players to stay in?"
From there you can test different solutions using samples of your player base, perhaps offering them free consumable items or other one-off boosts to make lower levels more fun. This lets you find innovative solutions without disrupting the gameplay experience for the rest of your audience.
"I believe it's important to stay nimble in a constantly changing environment where you are willing to pivot to a new strategy at a moment's notice based off of rigorous data analysis."
Renee Ya, Founder, Tiger Byte Studios
Keep in mind these other best practices when working through analytics:
- Monitor your key stats daily or even hourly to ensure smooth performance. A real-time visualization of the data pipeline may be recommended.
- Review key reports at least weekly with your team members. Ideally, you'll want to access high-level overviews and detailed reports on-demand and send them automatically to the appropriate team members.
- Keep asking questions and run queries against your data warehouse to figure out what's going on inside your game.
- Analyze the event history of your players to help diagnose individual problems reported by players.
- Design segments to track players as they move along the funnel, from attention to free play, to purchase.
- Experiment with how to motivate players to move through that gameplay funnel. Test in-game messaging, external marketing, and other methods.
- Collect and analyze crash data early and often to address key issues.
- Avoid focusing on headline metrics too much, but rather use data to dig into specific problems and solve them.
Real-time Analytics With PlayFab
Using a comprehensive backend platform is essential for LiveOps. PlayFab specifically is built to provide a robust data infrastructure out of the box, along with supplements such as integrated data warehousing.
PlayFab offers a rich suite of data and analytics capabilities:
- Real-time visualization of your data pipeline, to monitor your game and find deviations from normal trends.
- Troubleshooting tools to tweak your game and respond effectively to issues.
- Detailed reports of all major KPIs, on-demand and via email, to keep a close eye on performance and measure the impact of live changes.
- Data storage for all data generated and consumed by your game. File-based and object storage for large binary files or small JSON objects, and the ability to set permissions for who can read or write data.
- Real-time player segmentation to define segments based on player behavior and customize your game experience for each segment, and target segments with specific campaigns.
Ready to try adding analytics to your game? Get started by adding PlayFab to your game - and then check out our tutorial on generating your first PlayStream events. Explore all PlayFab's analytics features in our documentation.