
From Crash to Resolution: A Practical Guide for Xbox & Windows Developers
A closer look at how developers can quickly go from a player‑reported crash to a validated fix.

Crashes happen - even in the most polished games. What separates a quick turnaround from a weeks‑long fire drill is having a clear, repeatable pipeline for triage and resolution. In this post, we’ll walk through practical steps that Xbox and Windows developers can take to go from a player‑reported crash to a validated fix, fast.
The flow of player reported crashes
Before diving into crash specifics, it’s important to understand what happens when a player experiences a crash and how the data moves through the system. Here’s the typical flow:
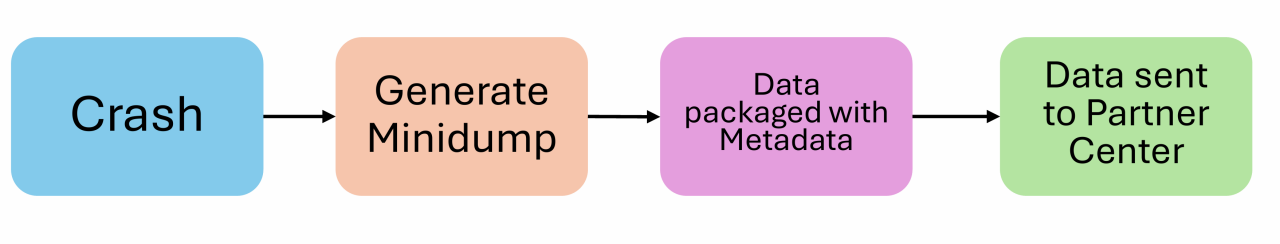
- Crash Occurs on Xbox or Windows Device
When a player’s game crashes, the system automatically generates a minidump along with telemetry data (e.g., stack trace, memory state, GPU info).
- Crash Data Packaged with Metadata
The crash report is bundled with useful metadata such as:- Game title and version
- Device configuration
- Session info
- Error codes
- Data Sent to Partner Center
The packaged crash data is sent to Partner Center, where it’s enriched with additional telemetry such as device hardware details (CPU/GPU models, driver versions), device model and OS build information. This information helps correlate crashes with environmental factors and identify patterns across devices and configurations.
- Diagnostic Pipeline Processing
Microsoft’s diagnostic pipeline normalizes the data and groups crashes into buckets based on signature (e.g., call stack similarity). This step helps identify whether the crash is widespread and occurring for multiple users.
Partner Center
As a developer, Partner Center is your best friend when it comes to diagnosing crashes and issues. It’s the central hub for managing your Xbox and Windows game lifecycle. All the crash data that was collected when the game crashed on a player’s PC or Xbox is visualised here. For crash triage, it’s invaluable because it aggregates player‑reported issues, telemetry, and symbolized minidumps into actionable buckets.
As a developer, you can quickly identify trends, prioritize high‑impact crashes, and drill into call stacks without juggling multiple tools. Beyond diagnostics, Partner Center ties reporting to builds and branches, making it easier to track regressions and validate fixes - all in one place.
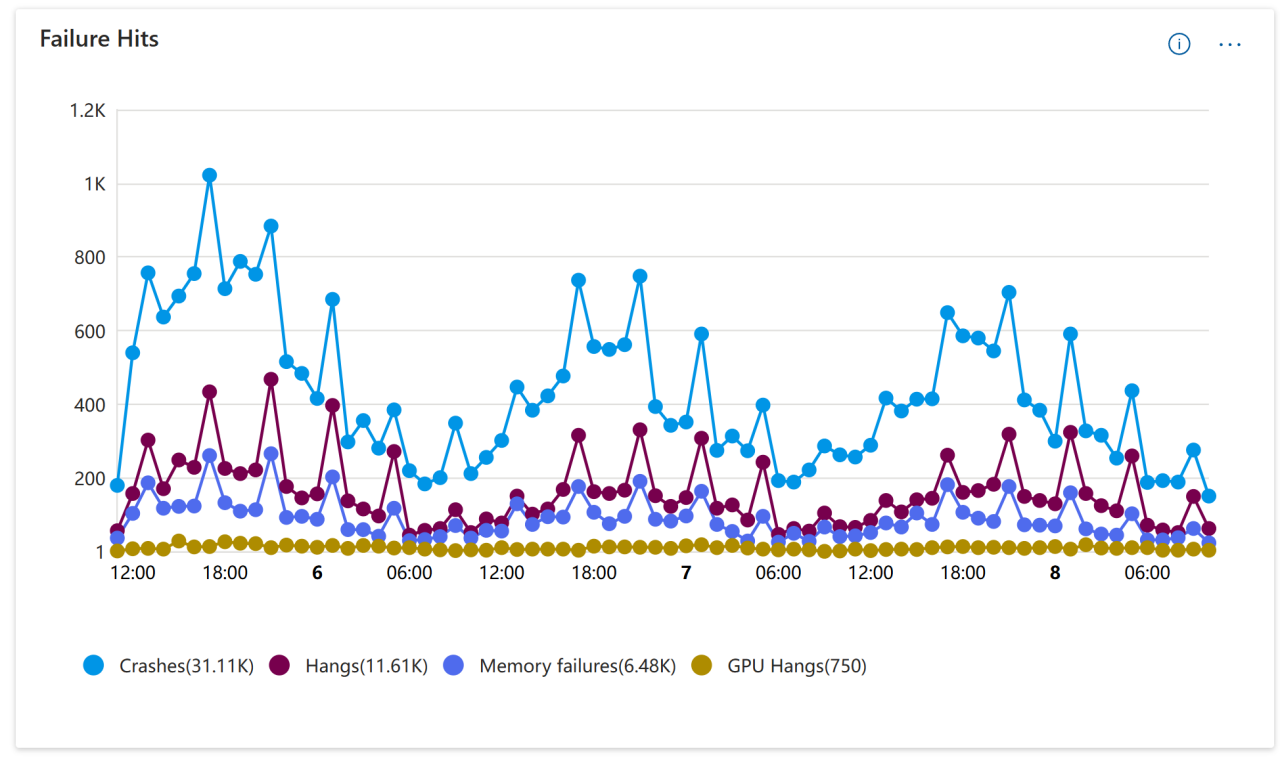
To give you an example of this, let’s take a look at the Health Dashboard in Partner Center. From the image below, you can see a detailed graph containing the crashes, hangs, memory failures and GPU hangs for a given time period.
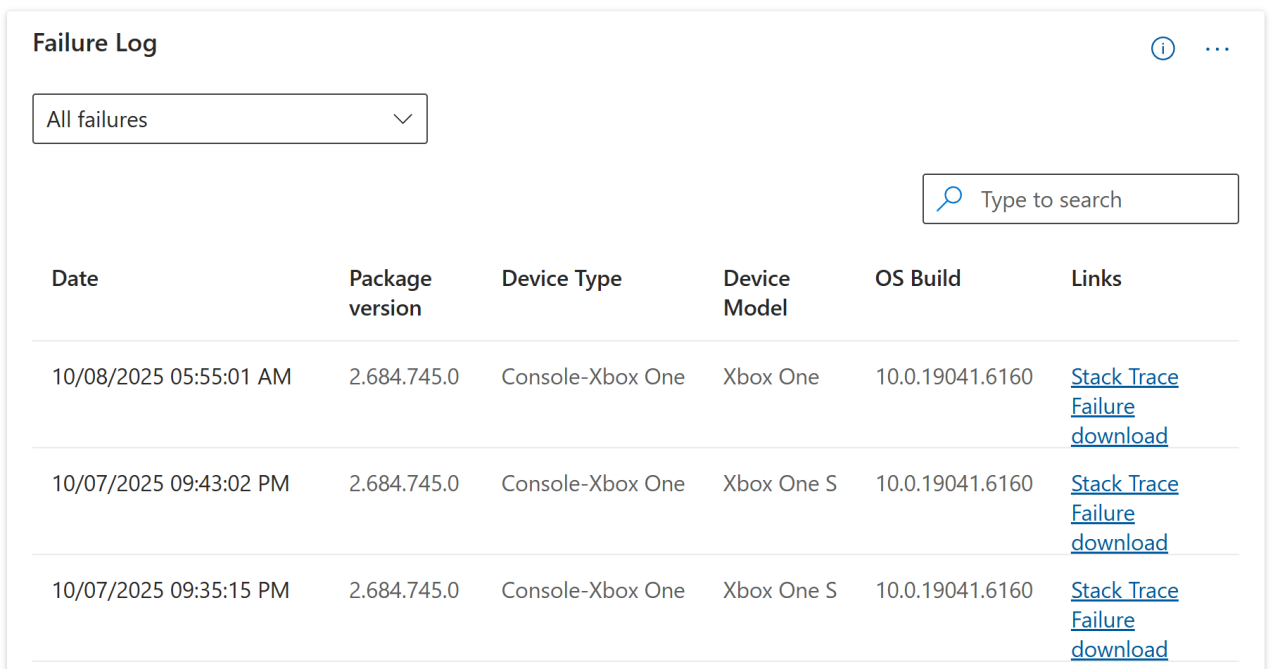
Diving deeper, you are also able to see the stack trace as well as download the dump files that occurred at the time of the crash.
Partner Center is a powerful tool for crash diagnostics, offering symbolized minidumps, crash bucketing, and trend graphs that help developers spot patterns quickly.
However, it’s not without limitations - missing symbols, privacy‑scrubbed data, and incomplete call stacks can slow down root‑cause analysis. For a more complete picture, you can layer Partner Center insights with third‑party crash tooling to capture richer telemetry and improve reproducibility.
To learn more about Partner Center, head over to the following link.
PackageUploader and Symbols
Speaking of symbols, it is vital to ensure that you have uploaded the corresponding symbols for your game. Uploading the correct symbols for each new build of your game is critical because they allow crash dumps to be fully symbolized, turning raw memory addresses into readable function names and line numbers.
Without symbols, you’re left with incomplete or meaningless call stacks, making root‑cause analysis far harder and slower. Proper symbol files enable accurate bucketing, trend analysis, and debugging. In short, symbols bridge the gap between a crash report and actionable insight - without them, fixing issues becomes guesswork.
To upload symbols, we recommend using PackageUploader.
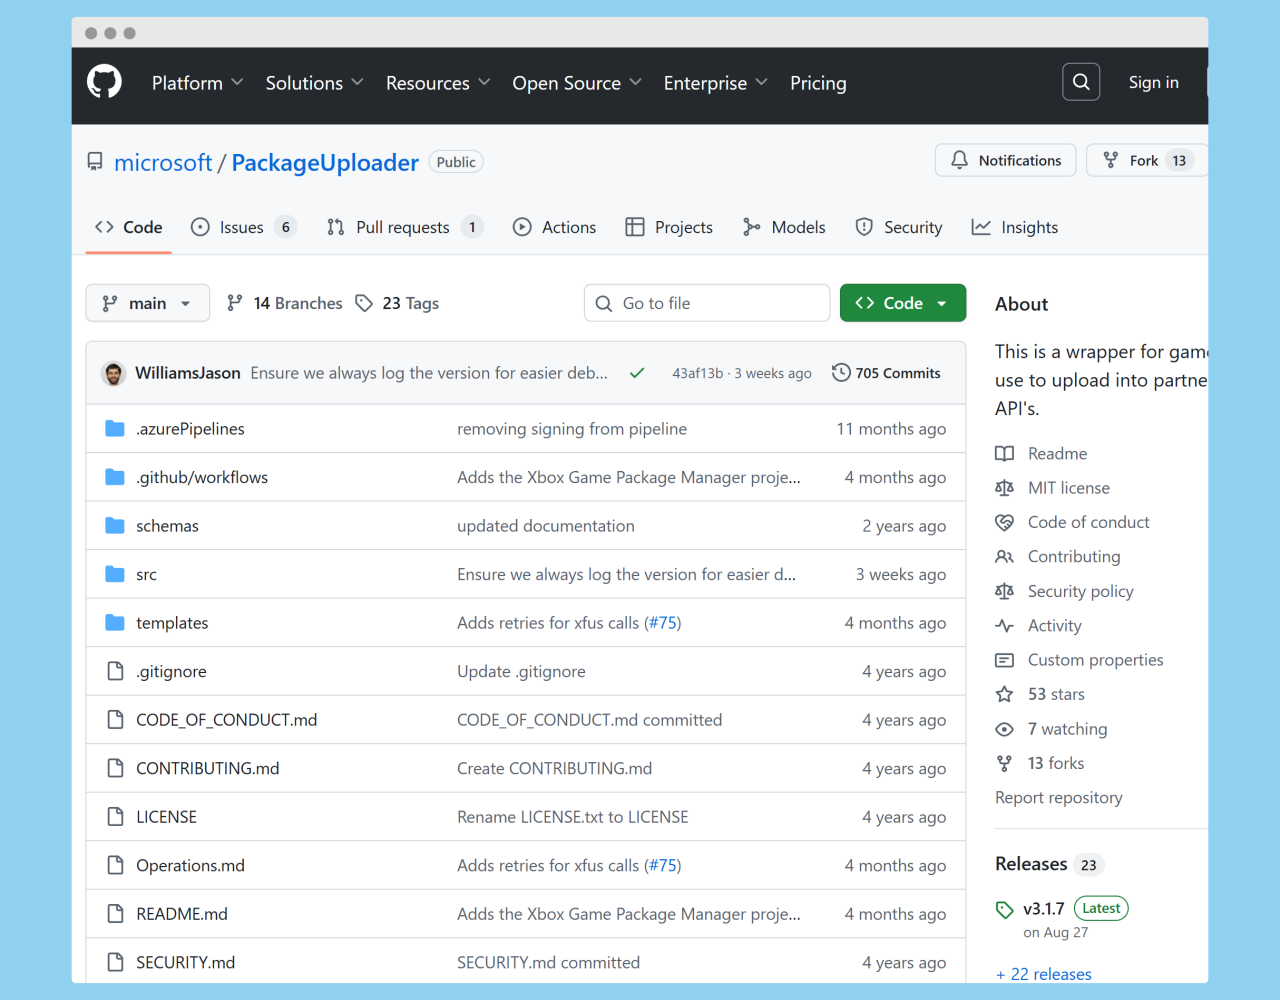
It provides you with two options:
- A command-line tool that you can integrate into your build pipelines or other development workflows.
- The other option is Xbox Game Package Manager, which is a Windows desktop app that provides a user-friendly graphical user interface for Package Uploader and MakePkg.
PackageUploader provides a streamlined workflow and enables you to monitor upload progress in real time through visual indicators.
Closing the Loop Fast
Now that you understand the basics behind crashes in the Xbox and PC ecosystem, let’s explore what an effective triage loop looks like. A triage loop is the backbone of crash management - it ensures issues move from detection to resolution without getting lost in the shuffle. The goal is speed and clarity: every crash should have an owner, a reproducible path, and a validated fix before closure.
A reliable triage loop looks like this:
- Assign an owner immediately - don’t let it float in “untriaged.”
- Reproduce the bug locally – confirm and classify the issue under controlled conditions to isolate the root cause.
- Validate fixes against the same crash bucket before closing.
Let’s break this down further. A reliable triage loop typically follows three key steps. First, assign an owner immediately. Crashes left in an “untriaged” state create bottlenecks and delay fixes, so make ownership clear from the start.
Second, reproduce the bug locally. This step is critical for understanding the root cause. By recreating the crash in a controlled environment, you can confirm the issue, gather detailed logs, and eliminate guesswork. A reproducible scenario ensures that fixes are targeted and verifiable, rather than speculative.
Finally, validate the fix against the same crash bucket before closing. This step confirms that the root cause was addressed and prevents regressions from slipping into future builds. By following this structured loop, teams can shorten time-to-fix, improve reliability, and keep player trust intact.
Focus on the 80/20 rule
When you first release your game and begin to receive your first crash reports, knowing where to start can be overwhelming. In this case, it is best to apply the 80/20 principle which states that roughly 80% of results come from 20% of the causes. This means that you should focus on the 20% of tasks that yield 80% of your success.
If you use this principle and focus on the crashes that make up the biggest percentage of the total crashes, you’ll be able to make the biggest impact for your players.
You can use the Failures View in Partner Center to help you.
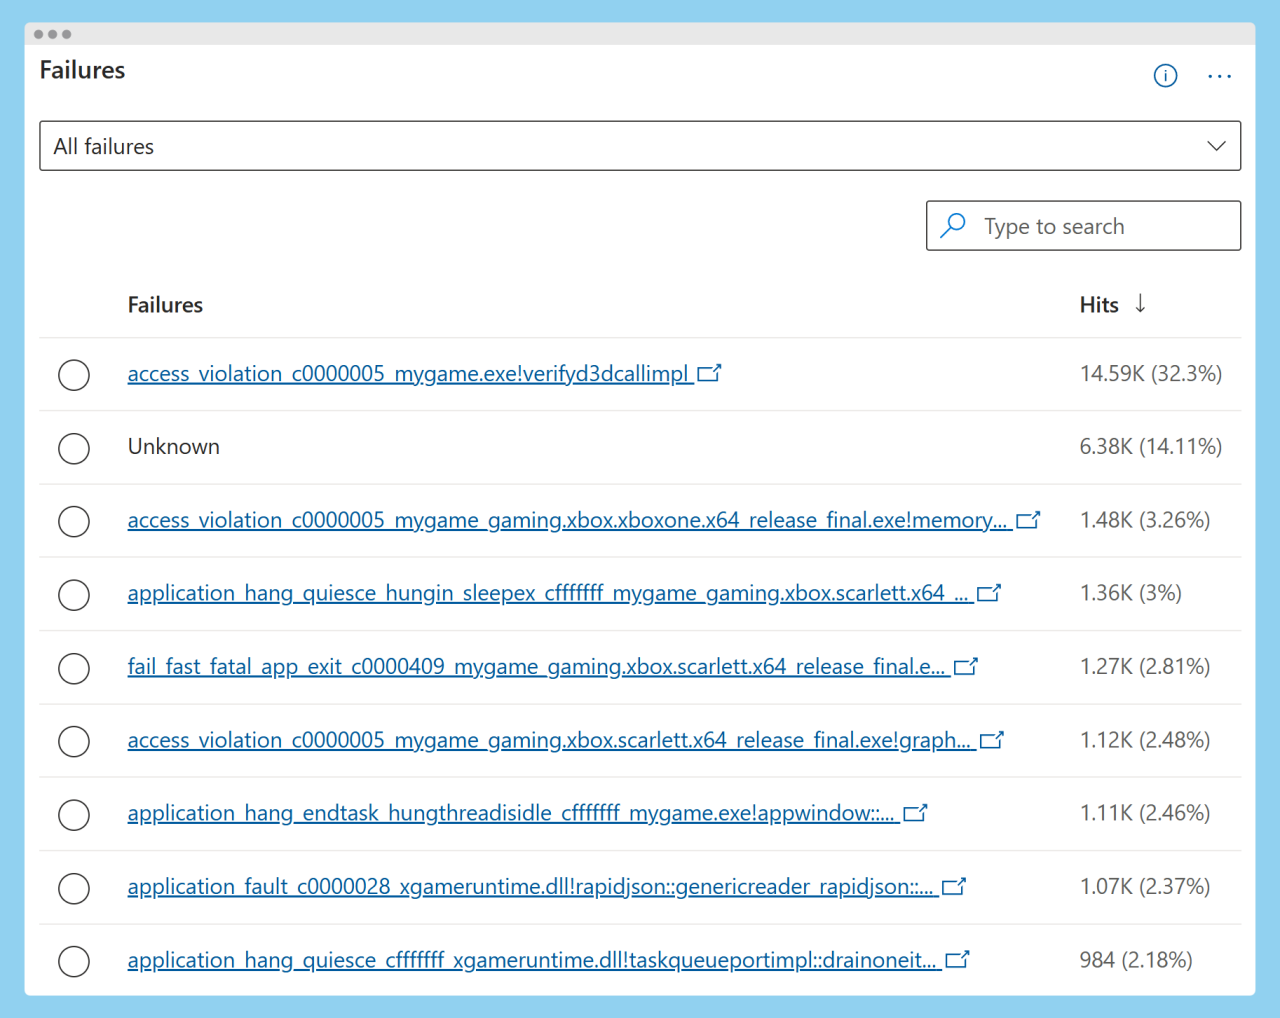
As you can see from the image above, it makes most sense to focus on the top crash which is an access violation in this case.
Measuring What Matters: Crash‑per‑MAU & Time‑to‑Fix
Tracking the right metrics keeps quality visible and helps you prioritize. Next, we'll examine two metrics: Crash per MAU and Time to Fix.
Crash‑per‑MAU (Monthly Active Users)
Crash per MAU is the number of crashes divided by your monthly active users. It is a critical metric because it normalizes crash frequency against your active player base, giving you a true measure of impact. If you only track raw crash counts, the data can be misleading - 10,000 crashes might sound catastrophic, but if you have 50 million monthly active users, that’s a very different story than if you have 50,000 users.
Here’s why developers should use Crash‑per‑MAU instead of looking at the overall picture:
- Contextualized Reliability: It accounts for scale, so you can compare stability across builds, platforms, or regions fairly.
- Prioritization: Spikes in Crash‑per‑MAU highlight regressions or high‑impact issues that affect player experience, not just noise from large populations.
- Benchmarking: Industry teams often set targets (e.g., <0.1 crashes per MAU) to maintain quality standards.
- Actionable Insights: It helps you decide where to invest engineering time and fixing a crash that affects 0.01% of users may not be as urgent as one hitting 5%.
To calculate Crash per MAU, we use the following formula:
Crash-per-MAU = Total Crashes in Period / Monthly Active Users
Time‑to‑Fix
Tracking Time‑to‑Fix helpful because it measures how quickly your team resolves high‑impact issues, and that speed directly affects player experience and retention.
Every day a crash persists can lead to negative reviews, churn, and lost revenue. A short Time‑to‑Fix shows players you respond fast and value stability. Tracking this metric over time highlights trends - are fixes getting faster or slower? It’s a key input for improving workflows, automation, and tooling.
Many teams target < 7 days for top impact crashes and if a crash bucket exceeds your target (e.g., 7 days), it signals a process bottleneck or resource gap.
So how do you track time-to-fix? Well, it’s a simple as recording the date/time when the crash bucket is created and then recording the date/time when the fix is in a public build.
Summary
Crashes happen, but they don’t have to slow you down. By understanding how player reports flow through Xbox and Windows ecosystems and by using tools like Partner Center, you can turn crash data into actionable fixes quickly. Uploading symbols, applying the 80/20 rule, and following a structured triage loop ensures issues move from detection to resolution quickly and efficiently.
Tracking metrics like Crash‑per‑MAU and Time‑to‑Fix will add visibility and help you prioritize the issues that matter most. These steps aren’t about firefighting; they’re about building a repeatable system that improves reliability and player experience. The right workflow transforms crashes into predictable, fixable events.